AI Agent Monitoring That Actually Works in Production
Practical AI agent monitoring guide covering static analysis, privacy-aware tracing, blast-radius review, alerting, and incident response.
By Jonny Freedman, CEO, Agntz
By Jonny Freedman · Published
The strongest advice on ai agent monitoring still gets the sequence wrong. Teams start with dashboards, alerts, and per-call logs, then wonder why a workflow looked healthy while it failed a handoff, invoked the wrong tool, or touched data it shouldn't have seen. The better approach starts earlier, at the source-code and dependency layer, where hidden capabilities, vendor references, and unregistered components can be mapped before the first live run.
That inside-out view matters because runtime visibility alone can't tell a security lead what was possible in the first place. Agntz public copy says more than 10,000 open-source agent repositories have been scanned and classified. That scale claim does not establish which governance gap is most common, and current product evidence should not be read as a complete resolved transitive-dependency graph. The practical point is narrower: if the inventory misses a model, tool, vendor, or data path, every later metric is built on a blind spot. shadow AI in your codebase
Table of Contents
- Why AI Agent Monitoring Has to Start Before Runtime
- Telemetry You Cannot Afford to Skip
- Static Analysis Compared With Runtime Tracing
- Blast Radius Scoring That Security Teams Will Trust
- Monitoring for Prompt Injection and Indirect Prompt Injection
- Alerting and SLOs That Reduce Noise
- Incident Playbook for Cascading Agent Failures
- 1. Detect the dependency chain
- 2. Scope impact with agent identity
- 3. Contain the smallest viable surface
- 4. Roll back to the last known good state
- 5. Reconstruct root cause from the first bad span
- 6. Feed the failure back into the baseline
- How often should agent repositories be rescanned for drift?
- What if runtime traces contradict the source-level inventory?
- Are agent cards required for compliance?
- Which agents should be instrumented first?
- Does Agntz replace runtime observability tooling?
Why AI Agent Monitoring Has to Start Before Runtime
A runtime-first program assumes the agent already exists in a trusted state. That assumption breaks as soon as a repository pulls in an embedded model, a hidden package call, or an MCP connection that no one reviewed. Monitoring then becomes reactive, which is exactly where regulated teams lose control of capability drift and unapproved data paths.
The more useful frame is inside-out versus outside-in. Inside-out monitoring begins with source code, declared packages, detected vendor references, and available dependency evidence. It produces a capability map and an AI Bill of Materials that show what the agent can reach, which vendors are visible in the repository, and where sensitive data could move. Because complete transitive edges are not yet persisted, teams should corroborate indirect dependency coverage with their package-management and build evidence. Outside-in telemetry still matters, but only after the inventory exists.
Practical rule: if a capability can't be named before deployment, it can't be trusted after deployment.
Source-level visibility earns its keep. A repository scan can reveal a tool binding, a permission path, or an indirect package or vendor reference long before runtime traces ever appear. That matters for teams trying to answer a basic governance question, what AI capability exists at all, and which controls already apply.
Agntz fits that pre-runtime layer because it reads source code to inventory AI capabilities, map them to controls, and generate evidence-backed findings. For teams trying to produce the first capability map quickly, the free first scan at Agntz is one way to turn an unknown codebase into a reviewable capability map.
Telemetry You Cannot Afford to Skip
The minimum useful unit is the session, not the isolated model call. A practical ai agent monitoring workflow should start with session-level tracing rather than isolated LLM calls, capturing each run as a connected trace with the prompt, model response, every tool call plus its inputs, the tool response, and the final action taken, as described in Latitude's production monitoring guidance. Anything less leaves gaps between the model, the tools, and the outcome.
A complete trace should also carry the fields security teams need. That includes session ID, step-level latency, actor identity, data classification, tool or resource used, action taken, and whether something was redacted or blocked. Capture prompts, tool arguments, and results only under explicit data-minimization rules: redact sensitive values, restrict access, and define retention limits before collection. Without those controls, telemetry can create a second store of sensitive data instead of a reliable evidence trail.
A good baseline is easier to interpret when the trace is structured the same way every time.
| Signal category | What to capture | Why it matters |
|---|---|---|
| Trace structure | Prompt, model response, tool calls, tool inputs, tool responses, final action | Reconstructs the full path of a run |
| Identity and data | Session ID, actor, data class, redaction or block outcome | Supports audit and containment |
| Performance | Step latency, token usage, tool-call errors | Separates slow reasoning from broken integrations |
| Outcome | Resolution success, policy compliance, abandonment | Shows whether the agent achieved the goal |
A trace should answer one question cleanly. What happened, in what order, and with what result. If the trace can't answer that, the alerting layer will guess. That guesswork is where most false confidence comes from.
Here's the main operational takeaway, instrument traces first, then derive metrics from those traces. Add targeted evaluation and alerts only after the baseline is stable. Teams that skip this step end up optimizing the wrong signal, usually per-call latency, while missing silent failures in the actual workflow.
Static Analysis Compared With Runtime Tracing
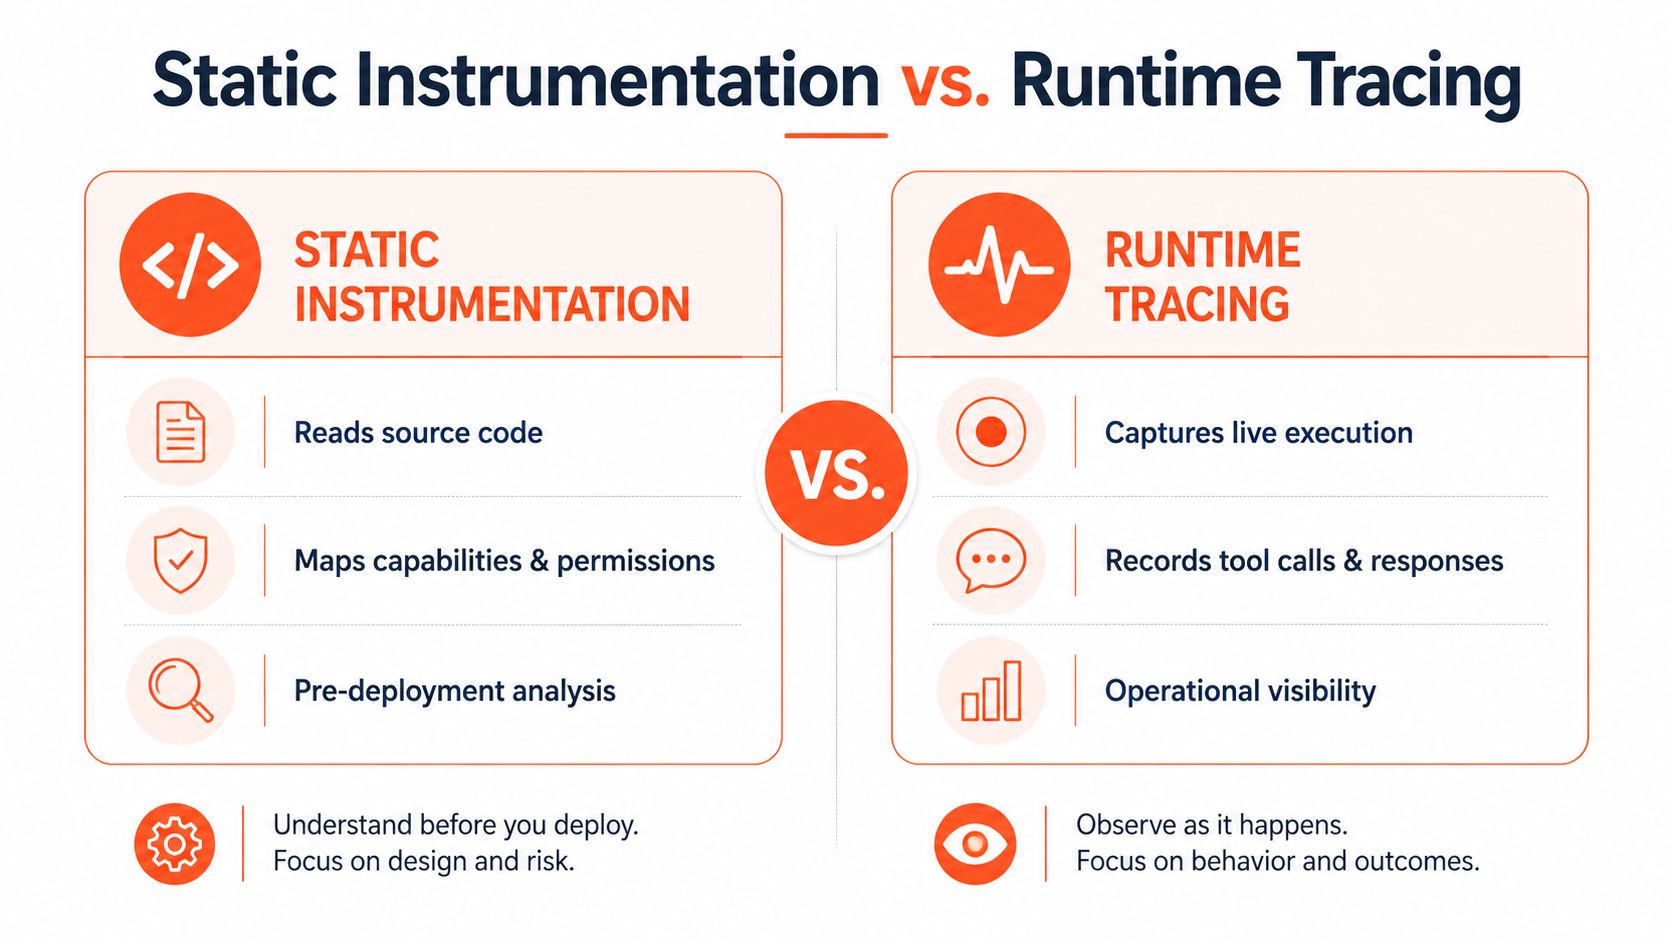
Static analysis and runtime tracing answer different questions, and teams need both. Static analysis reads the code and dependency graph before execution. Runtime tracing watches the agent while it's live. One gives inventory. The other gives behavior.
Static analysis is a strong control for capability discovery. It can map tools, permissions, data paths, and external services before the agent runs. That makes it useful for building an AIBOM, identifying hidden vendors, and attaching file, line, and call-path evidence to findings. It can also catch dormant or unregistered components that never surface in the live path.
Runtime tracing is the better control for execution evidence. OpenTelemetry's evolving GenAI semantic conventions provide common attributes and span patterns for models, agents, and tools, but the conventions remain under development. Teams should pin the version they implement and validate it against their own workflow model. That matters because agent failures usually happen in the middle of a tool chain, not at the request boundary.
| Dimension | Static analysis | Runtime tracing |
|---|---|---|
| Scope | Source, dependencies, permissions | Live execution, handoffs, tool use |
| Best answer | What can this agent do? | What did this agent do? |
| Audit value | Inventory and provenance | Replay and root-cause evidence |
| Weakness | Can't prove live behavior | Can't reveal hidden capability without source context |
The layered model is simple. Static analysis defines the blast area. Runtime tracing confirms what happened inside that area. Using one without the other creates a false sense of completeness.
Blast Radius Scoring That Security Teams Will Trust
Blast radius should be treated like a reach model, not a vague fear score. A security team needs to know which capabilities can touch which assets, how far a single failure can propagate, and whether that impact is reversible. The score only becomes useful when it is attached to concrete code paths and data classes.
Start with the capability map from source code. Then enumerate what each capability can read, write, invoke, or forward. After that, weight the result by sensitivity and reversibility. A capability that can read a ticket is not equal to one that can email a customer, change a record, and trigger another workflow.
A customer-support agent is a clean example. A calendar tool widens reach into scheduling data. A ticketing tool widens reach into case management records. An email tool adds outward propagation, because a bad action can leave the system boundary. Each added capability increases the set of assets that can be touched, and each asset adds a different audit burden.
The score should explain why a finding matters, not just that it exists.
The most defensible output is a finding attached to file, line, and call-path references. That gives auditors a reproducible trail and gives SOC analysts a way to isolate the capability that expanded exposure. A generic “high risk” label doesn't do that job.
For a separate, questionnaire-based triage step, the risk calculator can help structure an initial exposure discussion. It does not derive capability reach from source code and should not replace repository analysis or a capability map.
Monitoring for Prompt Injection and Indirect Prompt Injection
Prompt injection is not a side issue. It is a first-class monitoring problem because an agent can be steered into doing the wrong thing while still appearing to function normally. Direct prompt injection usually shows up in user input. Indirect prompt injection arrives through retrieved content, external documents, or other data sources that the agent treats as trustworthy.
The detection pattern is rarely subtle. Unexpected tool calls after a retrieval step are a red flag. So is instruction-like text embedded in content that should have been passive. Another warning sign is data egress that happens immediately after a document lookup or inbox read, especially if the agent had no reason to send that data anywhere.
The logging model needs to be strict. AI agent monitoring should produce a tamper-evident record of each agent action and each sensitive data element it touched, including who initiated the action, what data class was involved, which tool or resource was used, what action occurred, and what was redacted or blocked, as stated in Strac's monitoring guidance. That record is what lets investigators separate steering from exfiltration.
Three practical signals matter most:
- Unexpected tool choice: the agent calls a tool that doesn't fit the task.
- Instruction override in retrieved content: passive text starts behaving like a command.
- Post-retrieval egress: data leaves the workflow right after a suspicious fetch.
The main control is not just blocking. It is traceability. Investigators need to see the actor, the data class, the tool, and the outcome so they can reconstruct intent and effect. The AI agent security risks guide is a useful companion reference for this threat class because it keeps the focus on code-path exposure and agent behavior together.
Alerting and SLOs That Reduce Noise
Alerting works only when it points to user harm or policy failure. That's why agent quality has to be treated as an SLO problem, not a generic uptime problem. A system can be up and still fail to complete the user's task, violate policy, or burn budget through retries.
Start with immediate alerts for known safety, security, and policy failures, then collect enough representative traffic to calculate p50, p95, and p99 for operational metrics before tuning SLO thresholds. Baselines help reduce noise, but they should never suppress alerts for unauthorized tool use, sensitive-data exposure, or containment failures.
Operational note: aggregate averages hide localized drops. Split by workflow type and failure mode or the worst regression will stay buried.
A useful metric set looks like this:
| Signal category | Metric | What it tells you |
|---|---|---|
| Quality | Session success rate by workflow | Whether the agent completed the user goal |
| Reliability | Tool-call error and silent-failure rates | Whether integrations are failing without obvious crashes |
| Performance | Multi-turn latency percentiles | Whether long workflows are degrading |
| Efficiency | Cost per completed session | Whether the same outcome is getting more expensive |
| Governance | Policy compliance and failure-mode coverage | Whether the control set matches the risk profile |
The control loop should combine sampled quality evaluations, human review of high-risk sessions, and feedback into the scoring model. That creates a path from detection to remediation. It also lets teams prioritize the sessions that are most likely to matter, instead of reviewing random traffic and hoping the signal shows up.
Incident Playbook for Cascading Agent Failures
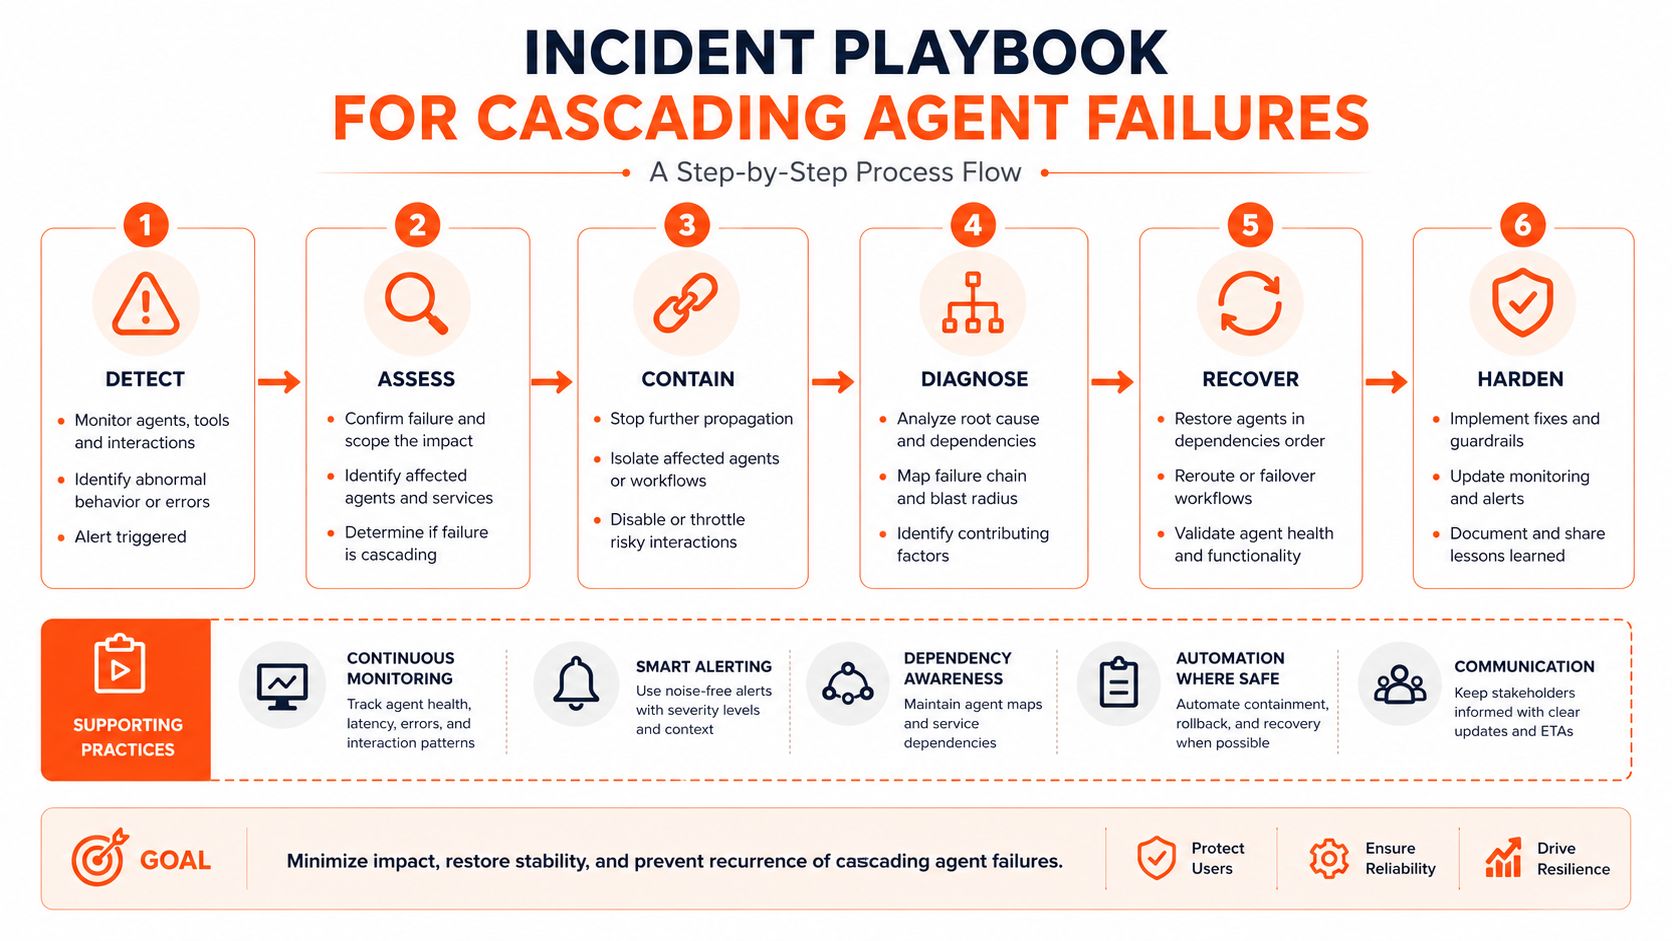
A single bad action becomes serious when it propagates across agents, queues, or shared tools. Generic uptime playbooks don't fit that pattern. The right response is scoped containment, not fleet-wide panic. The team needs to know which agent acted, which dependency carried the error forward, and where to stop the spread.
1. Detect the dependency chain
The first alert should come from cross-agent telemetry, handoff logs, or retry spikes in a workflow path. If only per-call metrics are watched, the chain will look like unrelated noise. Full-path telemetry is what reveals that one agent's output became another agent's input.
2. Scope impact with agent identity
Responder teams should use the agent identifier and its attached agent card to identify configuration, purpose, and expected behavior, as proposed in the agent card research. That makes it easier to distinguish a misbehaving subagent from a healthy upstream controller. It also shortens scoping when multiple agents share the same infrastructure.
3. Contain the smallest viable surface
Containment should focus on credentials, capabilities, or a specific workflow path. Pausing the whole fleet is usually too broad and creates unnecessary operational damage. Revoking a tool credential or disabling one action path is usually a cleaner first move when the blast radius is localized.
4. Roll back to the last known good state
Rollback only works if the team can replay what happened. Session traces, tool calls, and final actions become the evidence needed to reconstruct the last known good configuration. Teams should preserve the exact divergence point, not just the final failure.
5. Reconstruct root cause from the first bad span
Replay the logged interactions and isolate the first span where behavior diverged. That span usually tells the story. It might be a bad tool input, an unexpected retry loop, a corrupted retrieval result, or a permission path that reached too far.
6. Feed the failure back into the baseline
The incident should end with a named failure mode and a tracked control gap. That turns a one-off escalation into a measurable remediation item. A SOC lead can then see whether the issue was execution, governance, or both.
The gap this playbook fills is simple. Standard alerting shows that something went wrong. Cascading-agent response shows how the error moved, who it affected, and what to stop first. That's the difference between monitoring a service and defending an autonomous workflow.
How often should agent repositories be rescanned for drift?
Agntz currently checks active repositories daily, scanning changed source while reusing unchanged results where appropriate. Teams that require per-commit gates should add those controls in their own CI/CD workflow. The key is ensuring that changes in tools, vendors, or data paths re-enter review before release.
What if runtime traces contradict the source-level inventory?
Treat the contradiction as a governance signal, not a logging bug. The inventory may be missing an indirect dependency signal, an embedded model, or an unregistered component. Runtime traces may also show a path that only appears under certain inputs. Either way, the response is to reconcile source-level provenance with live behavior before trusting either view.
Are agent cards required for compliance?
They're not universally required by law, but they're useful for accountability and incident investigation. An agent card binds descriptive metadata to the agent identifier so responders can scope behavior faster. For regulated systems, that identity-linked provenance is often the difference between a clean evidence trail and a pile of raw logs that no one can interpret quickly.
Which agents should be instrumented first?
Instrument the agents with the widest data access, the most external tools, and the most branching logic first. Those are the ones most likely to create silent failures or downstream propagation. The next priority is any workflow that can read sensitive data, modify records, or trigger external actions that are hard to reverse.
Does Agntz replace runtime observability tooling?
No. It fills the pre-runtime inventory layer by reading source code, identifying declared packages and available dependency evidence, and mapping capability reach. Runtime observability still has to track traces, metrics, and incident behavior once the agent is live. The two layers solve different problems, and both matter in regulated production.
Agntz helps teams build the source-level capability map, AIBOM, and blast-radius evidence that should exist before an agent ships. If the current monitoring stack starts too late, visit Agntz for the free first scan and use it to get the inventory, provenance, and reach scoring that make runtime telemetry far more actionable.
Own your AI risk
Estimate your exposure in under 3 minutes. No install, no access to grant.
Estimate Your Exposure